Posted on

Melting ice sheets in Greenland contribute 25% to sea level rise

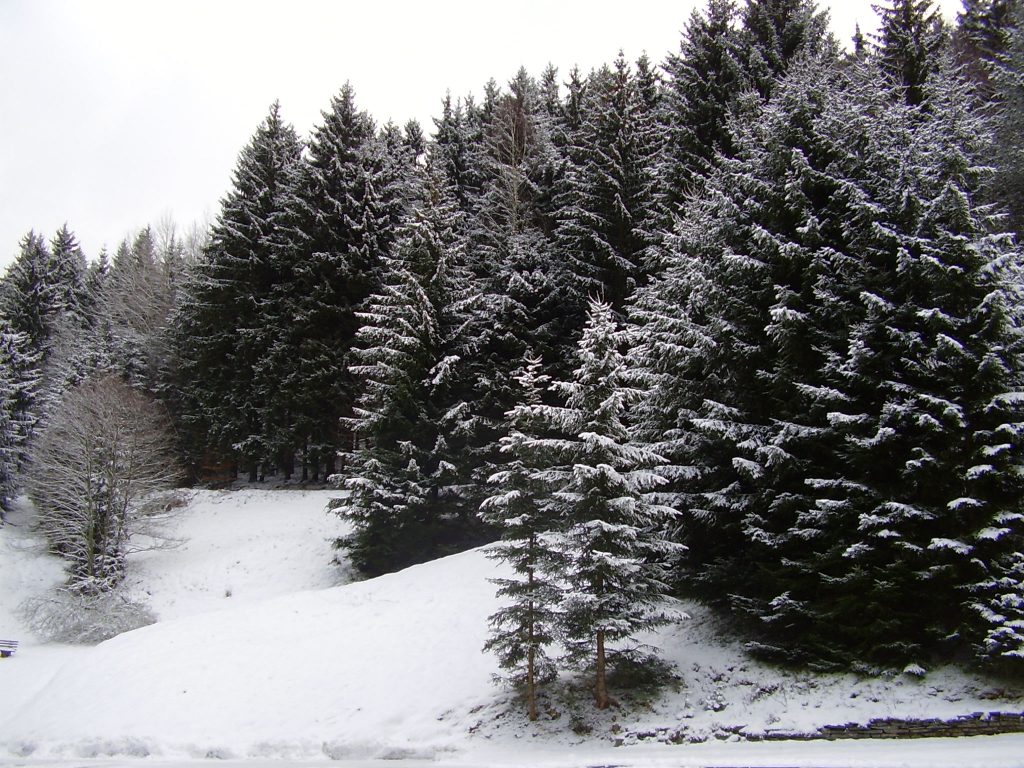
Recently we reported the loss of snow cover in Europe. The snow is not only gone in many parts of Europe, also Greenland’s ice cover is melting. The Greenland ice sheet contributes 25% to global sea-level rise. This makes it the largest contribution of the cryosphere. The increased mass loss of Greenland ice during the 21st century is mainly due to the increased surface water runoff, of which ~93% come directly from the small ablation zone of the ice sheet (~22% of the ice surface). As the snow melts in the summer, bare glacier ice is more exposed in this ablation zone. Naked ice is darker and less porous than snow. It absorbs more than twice the solar radiation while also holding back less meltwater. Smooth ice produces a large proportion (~78%) of the total outflow of Greenland into the sea, although in summer only a small area of ​​the ice is exposed. Accurately capturing the reduced albedo and the full extent of bare ice in climate models is critical to determining Greenland’s present and future runoff contribution to sea-level rise.

The mass loss of the Greenland ice sheet has recently increased due to the accelerated melting of its surface. As this melting is critically affected by surface albedo, understanding the processes and potential feedbacks regardinng the albedo is required for accurately forecasting mass loss. The resulting radiation variability of the ablation zone caused the ice layer to melt five times faster compared with hydrological and biological processes, which also darken the ice sheet. Variations in the snow limits due to the shallower ice layer at higher altitudes have an even greater impact on melt when the climate is warmer. As a result of these fluctuations, the mapped ice surface during the summer of 2012, the record year of snowmelt, was the largest and had an area of 300,050 km2. That is, bare ice accounted for 16% of the ice surface. The smallest extent of bare ice was 184,660 km2 and was observed in 2006. This corresponded to 10% of the ice surface, i.e. almost 40% less area than in 2012. However, the observed snowpack variation was high and the observation period was too short for a solid trend assessment.

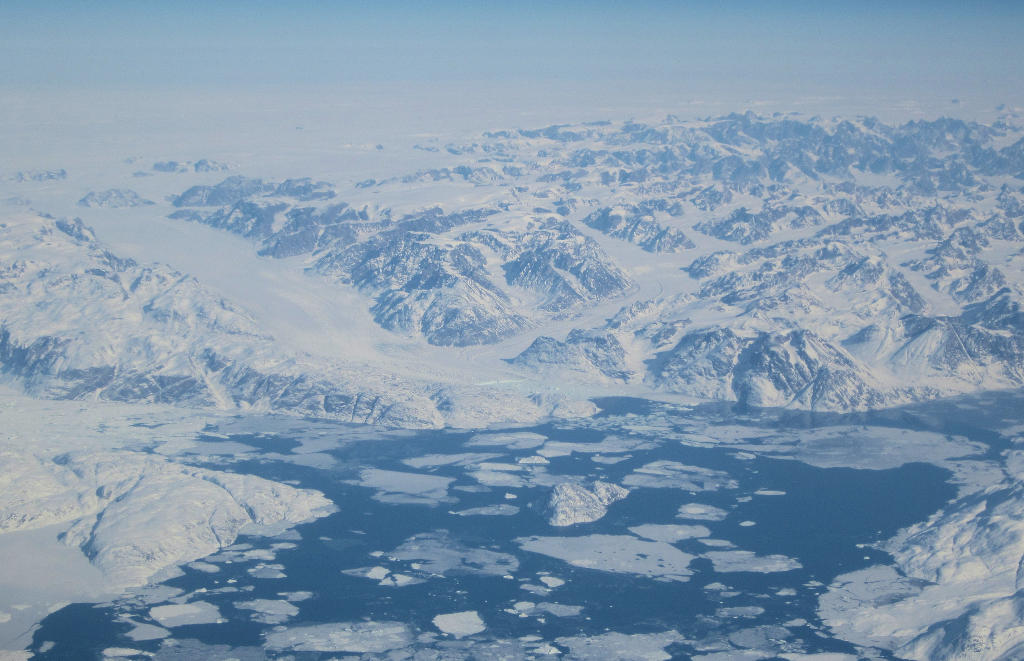
Current climate models are too inaccurate in predicting the sea level rise during flood years, leading to uncertainty in the estimation of Greenland’s contribution to global sea level rise. To understand the factors that influence melting, Jonathan Ryan of Brown University, Providence, Rhode Island, and his colleagues have investigated Greenland’s snow line. At altitudes below the snow line, the darker ice is not covered by snow. This snow line moves up or down during Greenland’s seasons. The researchers mapped these movements between 2001 and 2017 using satellite images. The average height of the snow line at the end of the summer in 2009 was between 1,330 m and then 1,650 m in 2012. The fluctuations in the snow line are the most important factor when it comes to how much solar energy the ice sheet absorbs. Modelers must consider this effect to improve their predictions. Knowing how much and how fast the Greenland ice melts will help us to take better protective measures. At Frontis Energy, we think that the best protection against sea-level rise is the prevention and recycling of CO2.

(Photo: Wikipedia)

Posted on

Economic losses caused by flooding due to global warming

In Europe, floods are linked to high fluctuations of atmospheric pressure. These variations are also known as the North Atlantic Oscillation. Stefan Zanardo and his colleagues at Risk Management Solutions, London, UK, analyzed historical records of severe floodings in Europe since 1870. They compared patterns of atmospheric pressure at the time of the floods. When the North Atlantic Oscillation is in a positive state, a depression over Iceland drives wind and storm throughout northern Europe. In a negative state, however, it makes southern Europe moister than usual. Normally, floods occur in northern Europe. They cause the most damage if the North Atlantic Oscillation was positive in winter. If enough rain has already fallen to saturate the soil, high risk conditions for flooding are met. Air pressure in Europe may change with global warming and public administrations should take this into account when assessing flood risk in a region, the researchers say.

This is important because flooding in Europe often causes loss of life, significant property damage , and business interruptions. Global warming will further worsen this situation. Risk distribution will change as well. The frequent occurrence of catastrophic flooding in recent years has sparked strong interest in this problem in both the public and private sectors. The public sector has been working to improve early warning systems. In fact, these early warning systems have economic benefits. In addition, various risk mitigating strategies have been implemented in European countries. These include flood protection, measures to increase risk awareness, and risk transfer through better dissemination of flood insurance. The fight against the root cause, global warming that is, however, is still far behind to what is needed.

Correlations between large-scale climate patterns, and in particular the North Atlantic Oscillation, and extreme events in the water cycle on the European continent have long been described in the literature. With with more severe and more often flooding as well as alarming global warming scenarios, raising concerns over future flood-related economic losses have become the focus of public attention. Although it is known that climatic patterns also control meteorological events, it is not always clear whether this link will affect the frequency and severeness fo flooding and the associated economic losses. In their study, the researchers relate the North Atlantic Oscillation to economic flood losses.

The researchers used recent data from flood databases as well as disaster models to establish this relation. The models allowed the quantification of the economic losses that ultimately caused by the North Atlantic Oscillation. These losses vary widely between the countries within the influence of the North Atlantic Oscillation. The study shows that the North Atlantic Oscillation can well predict the average losses in the long term. Based on the predictability of the North Atlantic Oscillation, the researchers argue that, in particular, the temporal variations of the flood risks caused by climate oscillations can be forecast. This can help to take encounter catastrophic flood events early on. As a result, flood damage can be minimized or even avoided. As scientists improve their predictions for the North Atlantic Oscillation, society will be better prepared for future flooding.

(Photo: Wikipedia, Stefan Penninger, Sweden)

Posted on

White Christmas, going … gone

In Germany, we seem to remember White Christmas from fairy tales only. Now there is also scientific evidence that winter snow cover in Europe is thinning. Thanks to global warming, the snow cover decrease accelerated

The research group behind Dr. Fontrodona Bach of the Royal Netherlands Meteorological Institute in De Bilt analyzed snow cover and climate data from six decades from thousands of weather stations across Europe. The researchers found that the mean snow depth, with the exception of some local extremely cold spots, has been decreasing since 1951 at 12% per decade. The researchers recently published their research results in the journal Geophysical Research Letters. The amount of “extreme” snow cover affecting local infrastructure has declined more slowly.

The observed decline, which accelerated after the 80s, is the result of a combination of rising temperatures and the impact of climate change on precipitation. The decreasing snow cover can reduce the availability of fresh water during the spring melt, the authors noted.

(Photo: Doris Wulf)

Posted on

Ammonia energy storage #1

The ancient, arid landscapes of Australia are not only fertile soil for huge forests and arable land. The sun shines more than in any other country. Strong winds hit the south and west coast. All in all, Australia has a renewable energy capacity of 25 terawatts, one of the highest in the world and about four times higher than the world’s installed power generation capacity. The low population density allows only little energy storage and electricity export is difficult due to the isolated location.

So far, we thought the cheapest way to store large amounts of energy was power-to-gas. But there is another way to produce carbon-free fuel: ammonia. Nitrogen gas and water are enough to make the gas. The conversion of renewable electricity into the high-energy gas, which can also be easily cooled and converted into a liquid fuel, produces a formidable carrier for hydrogen. Either ammonia or hydrogen can be used in fuel cells.

The volumetric energy density of ammonia is almost twice as high than that of liquid hydrogen. At the same time ammonia can be transported and stored easier and faster. Researchers around the world are pursuing the same vision of an “ammonia economy.” In Australia, which has long been exporting coal and natural gas, this is particularly important. This year, Australia’s Renewable Energy Agency is providing 20 million Australian dollars in funding.

Last year, an international consortium announced plans to build a $10 billion combined wind and solar plant. Although most of the 9 terawatts in the project would go through a submarine cable, part of this energy could be used to produce ammonia for long-haul transport. The process could replace the Haber-Bosch process.

Such an ammonia factories are cities of pipes and tanks and are usually situated where natural gas is available. In the Western Australian Pilbara Desert, where ferruginous rocks and the ocean meet, there is such an ammonia city. It is one of the largest and most modern ammonia plants in the world. But at the core, it’s still the same steel reactors that work after the 100 years-old ammonia recipe.

By 1909, nitrogen-fixing bacteria produced most of the ammonia on Earth. In the same year, the German scientist Fritz Haber discovered a reaction that could split the strong chemical bond of the nitrogen, (N2) with the aid of iron catalysts (magnetite) and subsequently bond the atoms with hydrogen to form ammonia. In the large, narrow steel reactors, the reaction produces 250 times the atmospheric pressure. The process was first industrialized by the German chemist Carl Bosch at BASF. It has become more efficient over time. About 60% of the introduced energy is stored in the ammonia bonds. Today, a single plant produces and delivers up to 1 million tons of ammonia per year.

Most of it is used as fertilizer. Plants use nitrogen, which is used to build up proteins and DNA, and ammonia delivers it in a bioavailable form. It is estimated that at least half of the nitrogen in the human body is synthetic ammonia.

Haber-Bosch led to a green revolution, but the process is anything but green. It requires hydrogen gas (H2), which is obtained from pressurized, heated steam from natural gas or coal. Carbon dioxide (CO2) remains behind and accounts for about half of the emissions. The second source material, N2, is recovered from the air. But the pressure needed to fuse hydrogen and nitrogen in the reactors is energy intensive, which in turn means more CO2. The emissions add up: global ammonia production consumes about 2% of energy and produces 1% of our CO2 emissions.

Our microbial electrolysis reactors convert the ammonia directly into methane gas − without the detour via hydrogen. The patent pending process is particularly suitable for removing ammonia from wastewater. Microbes living in wastewater directly oxidize the ammonia dissolved in ammonia and feed the released electrons into an electric circuit. The electricity can be collected directly, but it is more economical to produce methane gas from CO2. Using our technology, part of the CO2 is returned to the carbon cycle and contaminated wastewater is purified:

NH3 + CO2 → N2 + CH4


Posted on

Fresh CO2 − Now Even Cheaper!

Hurry up while stocks last, you may want to add. Carbon dioxide (CO2) is a waste product from the combustion of fossil fuels such as oil, gas and coal. It is almost worthless because it finds little use. However, technologies such as power-to-gas or electrosynthesis of methanol are able to convert CO2 directly into a valuable, albeit cheap, product. This increases the commercial interest in CO2 and ultimately the filtering from the air becomes economically interesting. That is, filtering CO2 from the air is now more than just an expensive strategy to fight global warming. Recently, a detailed economic analysis has been published in the journal Joule, which suggests that this filter technology could soon become a viable reality.

The study was published by the engineers of the Canadian company Carbon Engineering in Calgary, Canada. Since 2015, the company has been operating a pilot plant for CO2 extraction in British Columbia. This plant − based on a concept called Direct Air Capture (DAC) − formed the foundation for the presented economic analysis. It includes the costs from suppliers of all major components. According to the study, the cost of extracting a ton of CO2 from the air ranges from $94 to $232, depending on a variety of design options. The latest comprehensive analysis of DAC estimated $600 per tonne and was published by the American Physical Society in 2011.

In addition to Carbon Engineering, the Swiss company Climeworks also works on DAC in Zurich. There, the company has launched a commercial pilot that can absorb 900 tonnes of CO2 from the atmosphere every year for use in greenhouses. Climeworks has also opened a second plant in Iceland that can capture 50 tonnes of CO2 per year and bury it in subterranean basalt formations. According to Daniel Egger of Climeworks, capturing a ton of CO2 at their Swiss site costs about $600. He expect the number to fall below $100 per ton over the next five to ten years.

Technically, CO2 is dissolved in an alkaline solution of potassium hydroxide which reacts with CO2 to form potassium carbonate. After further processing, this becomes a solid residue of calcium carbonate, which releases the CO2 when heated. The CO2 could then be disposed of underground or used to make synthetic, CO2-neutral fuels. To accomplish this, Carbon Engineering has reduced the cost of its filtration plant to $94 per ton of CO2.

CO2-neutral fuel, from carbon dioxide captured from the air and electrolytic hydrogen.

Assuming, however, that CO2 is sequestered in rock, a price of $100 per ton would translate into 0.2 cent per liter gasoline. Ultimately, the economics of CO2 extraction depend on factors that vary by location, including the price of energy and whether or not a company can access government subsidies or a carbon trading market. But the cost per ton of DAC-CO2 is likely to remain above the real market price of CO2 in the near future. For example, emission certificates in the European Union’s trading system are around €16 per tonne of CO2. If CO2 extraction technology were to gain a foothold in markets where carbon can be sold at DAC price, then DAC would of course become economical. Conversion into useful products product such as plastic or fuel could help to include the DAC premium. Alberta seems a great location because its oil is of low quality and comes at high production costs. Moreover, the size of the DAC plant suggests this is done best in Canada, given the size of the country. Albertans may want to reconsider their business model.

At Frontis Energy, we are excited about this prospect. CO2 is accessible everywhere and DAC is helping us convert it into methane gas. Power-to-gas is perfect for this. However, there would still have something to happen. $100 per ton is already good (compared to $600), but to be able to economically place a product like methane on the market it should be more like $10 per tonne:

CO2 economy of power-to-gas with electrolytic hydrogen. Cal, California, EOR, enhanced oil recovery.

Sure, we always complain, but we still cannot wait to see how the price of DAC continues to fall and wish Carbon Engineering to Climeworks all the best. Keep it up!

(Photos: Carbon Engineering)

Posted on

You Can Have the Pie and Eat It

In Paris, humanity has set itself the goal of limiting global warming to 1.5 °C. Most people believe that this will be accompanied by significant sacrifice of quality of life. That is one reason why climate protection is simply rejected by many people, even to the point of outright denial. At Frontis Energy, we think we can protect the climate and live better. The latest study published in Nature Energy by a research group around Arnulf Grubler of the International Institute for Applied Systems Analysis in Laxenburg, Austria, has now shown that we have good reasons.

The team used computer models to explore the potential of technological trends to reduce energy consumption. Among other things, the researchers said that the use of shared car services will increase and that fossil fuels will give way to solar energy and other forms of renewable energy. Their results show that global energy consumption would decrease by about 40% regardless of population, income, and economic growth. Air pollution and demand for biofuels would also decrease, which would improve health and food supplies.

In contrast to many previous assessments, the group’s findings suggest that humans can limit the temperature rise to 1.5 °C above preindustrial levels without resorting to drastic strategies to extract CO2 from the atmosphere later in the century.

Now, one can argue whether shared car services do not cut quality of life. Nevertheless, we think that individual mobility can be maintained while protecting our climate. CO2 recovery for the production of fuels (CO2 recycling that is) is such a possibility. The Power-to-Gas technology is the most advanced version of CO2 recycling and should certainly be considered in future studies. An example of such an assessment of the power-to-gas technology was published by a Swiss research group headed by Frédéric Meylan, who found that the carbon footprint can be neutralized with conventional technology after just a few cycles.

(Picture: Pieter Bruegel the Elder, The Land of Cockaigne, Wikipedia)

Posted on

Mapping Waste-to-Energy

Most readers of our blog know that waste can be easily converted into energy, such as in biogas plants. Biogas, biohydrogen, and biodiesel are biofuels because they are biologically produced by microorganisms or plants. Biofuel facilities are found worldwide. However, nobody knows exactly where these biofuel plants are located and where they can be operated most economically. This knowledge gap hampers market access for biofuel producers.

At least for the United States − the largest market for biofuels − there is now a map. A research team from the Pacific Northwest National Laboratory (PNNL) and the National Renewable Energy Laboratory (NREL) published a detailed analysis of the potential for waste-to-energy in the US in the journal Renewable and Sustainable Energy Reviews.

The group focused on liquid biofuels that can be recovered from sewage sludge using the Fischer-Tropsch process. The industrial process was originally developed in Nazi Germany for coal liquefaction, but can also be used to liquefy other organic materials, such as biomass. The resulting oil is similar to petroleum, but contains small amounts of oxygen and water. A side effect is that nutrients, such as phosphate can be recovered.

The research group coupled the best available information on these organic wastes from their database with computer models to estimate the quantities and the best geographical distribution of the potential production of liquid biofuel. The results suggest that the United States could produce more than 20 billion liters of liquid biofuel per year.

The group also found that the potential for liquid biofuel from sewage sludge from public wastewater treatment plants is 4 billion liters per year. This resource was found to be widespread throughout the country − with a high density of sites on the east cost, as well as in the largest cities. Animal manure has a potential for 10 billion liters of liquid biofuel per year. Especially in the Midwest are the largest untapped resources.

The potential for liquid biofuel from food waste also follows the population density. For metropolitan areas such as Los Angeles, Seattle, Las Vegas, New York, etc., the researchers estimate that such waste could produce more than 3 billion liters per year. However, food leftovers also had the lowest conversion efficiency. This is also the biggest criticism of the Fischer-Tropsch process. Plants producing significant quantities of liquid fuel are significantly larger than conventional refineries, consume a lot of energy and produce more CO2 than they save.

Better processes for biomass liquefaction and more efficient use of biomass still remain a challenge for industry and science.

(Photo: Wikipedia)

Posted on

The Photosynthetic CO2 Race − Plants vs. Algae

Algae store CO2 but also release it. Some of us may know that. However, so far it was unknown that algae may release additional CO2 due to global warming. That’s what researcher Chao Song and his colleagues of the University of Georgia in Athens, GA, found out.

As they published in the journal Nature Geoscience, the metabolism of algae and other microbes is accelerated by higher water temperatures in large streams. This could lead to some rivers releasing more CO2 than they do now. This could, in turn, further accelerate global warming. Although photosynthesis in algae would accelerate, plants along the river banks would be even faster. Decomposition of the plant material would immediately release the so fixed CO2. With extra nutrients from plants, competing microorganisms would overgrow the river algae or the algae would degrade the plant material themselves.

To calculate the CO2 net effect, scientists monitored temperature, dissolved oxygen, and other parameters in 70 rivers worldwide. Then they used their data for computer models. These models suggest that over time, accelerated photosynthesis in some rivers may not keep pace with plant growth. This net increase of 24% of the CO2 released from rivers could mean an additional global temperature increase of 1 °C.

However, the computer model still lacks some data. For example, the sedimentation rates are not taken into account. In addition, not all banks grow plants. Many rivers pass only sparsely vegetated land. As always, more research is needed to get better answers.

(Photo: Wikipedia)

Posted on

Decarbonizing Planet Earth – Nuclear vs. Renewable

Adding to the controversial scientific debate whether renewable or nuclear energy decarbonize the atmosphere quicker, Lovins et al of the Rocky Mountain Institute in Basalt, Colorado, argue that renewable energy is doing a better job. In their recent study, published in Energy Research & Social Science, they analyzed 17 years of recent energy resource development worldwide to support their conclusion. Their paper stands in contrast to numerous previous studies, including a 2016 report published by Cao et al in Science, claiming that nuclear power is better suited for fast decarbonization. However, the nuclear waste problem still remains unresolved.