Posted on

CO2-neutral traffic

Fossil fuels have made tremendous social and economic advances pssible. This becomes clear, among other things, if you look at the increase in road traffic. Around 90 million vehicles were produced in 2019. In 2000 it was 60 million. It is assumed that the number of vehicles produced by 2030 will grow to 120 million. The increase in road mobility undoubtedly has a positive impact on social mobility and economic growth. However, this also makes the traffic increase a self-accelerating process. Economic growth in the Brics countries (Brazil, Russia, India, China and South Africa) is particularly crucial in this regard. At the same time, it is expected that the proportion of electric vehicles, including hybrids, will also increase sharply. However, whether this is realistic, given the limited lithium reserves, can again be doubted.

In 2010 more than 1 billion cars were registered worldwide. With an annual increase of around 3%, it was already 1.3 billion in 2019. These emit around 6.0 billion tons of CO2 annually (out of a total of 33 billion tons worldwide), making them the largest expanding source of CO2. Energy-related CO2 emissions are generally continuing to rise, although this increase was briefly interrupted by the global health crisis of 2020. In addition, there are 20 to 30% of emissions from the production of fuels and the manufacture and disposal of vehicles.

Life cycle analyzes of vehicles with different drive concepts are the subject of many studies. When it comes to CO2 emissions, the energy source is crucial. Two main developments are discussed today: the electrification of the propulsion system (i.e. fully and partially electrified vehicles) and the electrification of fuels (i.e. hydrogen and synthetic fuels).

In the manufacture of synthetic fuels, water is broken down into oxygen and hydrogen by electrolysis with renewable electricity. Due to the temporary oversupply of renewable electricity, this energy is particularly cheap. The hydrogen can then be used in hydrogen vehicles propelled by fuel cells. Alternatively, CO2 can be converted into hydrocarbons with hydrogen and then used in conventional combustion engines in a climate-neutral manner. The advantage of fuel cell vehicles is their high efficiency and the low cost of electrolysis. The disadvantage is the lack of a hydrogen infrastructure. Converting from hydrocarbons to hydrogen would cost trillions. The cheaper alternative would be synthetic hydrocarbons. However, the development is still in its infancy and the production of synthetic fuels cannot yet be carried out on a large scale.

Hydrogen and synthetic fuels are a necessary addition to electromobility, especially for long-distance and load transport. The widespread view that the low level of efficiency of internal combustion engines makes these fuels uninteresting ignores the possibility of using them to store and transport energy and to enable climate neutrality for air and shipping traffic. If you compare the CO2 emissions from electric motors and electrified fuels, it becomes clear that these mainly depend on the CO2 pollution of the electricity used.

Synthetic fuel sources

The production of synthetic fuel requires renewable electricity, water and CO2. The technical processes are known. However, the first large-scale industrial plants are only in the planning phase. However, pilot projects such as that of the Canadian company Carbon Engineering have shown the technical feasibility of scaling. The generation costs depend mainly on the size of the plant and the electricity price, which results from the local conditions, the structure of the electricity market and the share of renewable electricity.

The decentralized production of these fuels brings not only climate neutrality but also geopolitical gains. Since CO2 and renewable energy – in contrast to lithium – are generally accessible resources, users of this technology become independent of energy imports. At Frontis Energy we think these are strong arguments in favor of synthetic fuels.

Posted on

Accelerated deforestation in the EU

Forests are vital to our society. In the EU, forests make up around 38% of the total land area. They are important carbon sinks as they eliminate around 10% of EU greenhouse gases. Efforts to conserve them are a key part of EU climate targets. However, the increasing demand for forest products poses challenges for sustainable forest management.

According to a report recently published in the renowned science magazine Nature, the EU’s deforested area has increased by 49% and with it the loss of biomass (69%). This is due to large-scale deforestation, which reduces the continent’s carbon absorption capacity and accelerates climate change.

The analyzed a series of very detailed satellite data. The authors of the report show that deforestation occurred primarily on the Iberian Peninsula, the Baltic States, and Scandinavia. Deforestation of forest areas increased by 49% between 2016 and 2018. Satellite images also show that the average area of ​​harvested land across Europe has increased by 34 percent, with potential implications for biodiversity, soil erosion and water regulation.

The accelerating deforestation could thwart the EU’s strategy to combat climate change, which aims in particular to protect forests in the coming years, the experts warn in their study. For this reason, the increasing use of forests is challenging to maintain the existing balance between the demand for wood and the need to preserve these key ecosystems for the environment. Typically, industries such as bioenergy or the paper industry are the driving forces behind deforestation.

The greatest acceleration in deforestation was recorded in Sweden and Finland. In these two countries, more than 50% of the increase in deforestation in Europe has been recorded. Next in line are Spain, Poland, France, Latvia, Portugal and Estonia, which together account for six to 30% of the increase, the study said.

Experts suggest linking deforestation and carbon emissions in model calculations before setting new climate targets. The increase in forest harvest is the result of the recent expansion of global wood markets, as evidenced by economic indicators for forestry, timber bioenergy and international trade. If such a high forest harvest continues, the EU’s vision of forest-based mitigation after 2020 could be compromised. The additional carbon losses from forests would require additional emission reductions in other sectors to achieve climate neutrality.

At Frontis Energy, we find the competition between bioenergy and this important carbon sink particularly disturbing, as both are strategies to mitigate global warming.

(Photo: Picography / Pixabay)

Posted on

Energy storage in Italy

Italy’s Electricity Portfolio

In our previous post we briefed you on the energy storage potential in the United Kingdom. With Brexit, Italy will become the third largest member state after Germany and France. With extensive mountain terrain in the north, Italy has long been dependent upon hydroelectric generation. Until the mid 1960s hydropower represented nearly all electricity production in Italy. The installed capacity of hydropower has been stagnant since the mid 1960s, with a rapid growth in fossil fuel based generation driving the overall share of hydropower fall from ~90% to 22% in 2014. A detailed breakdown of electricity sources in Italy is shown below.

Electricity Production in Italy (2014)

Considerable effort has been made to transition Italy to a low carbon electricity sector. As of 2016, Italy had the 5th highest installed solar capacity in the world and the 2nd highest per capita solar capacity, behind only Germany. In addition to its impressive solar progress Italy ranks 6th worldwide in geothermal with 0.9 GW.

Italy’s solar growth was propelled by feed-in-tariffs that wer enacted in 2005. This provided residential PV owners with financial compensation for energy sold to the grid. However, the feed-in-tariff program ceased on 06 July 2014 after the €6.7 billion subsidy limit was reached.

Even with its impressive accomplishments in renewable energy, traditional thermal generation (natural gas) still account for ~60% of total electricity generation in Italy. How much effort will go into reducing this number is still unclear. Italy has committed to 18% renewables by 2020 and is nearly 70% of the way there already so there is little urgency on reducing fossil-based electricity from the perspective of meeting this target. However, Italy is heavily reliant on fossil fuel imports (Deloitte) and energy security requirements will likely continue to push the development of more domestic electricity sources like renewables.

Energy Storage Facilities

Italy is dominating the electro-chemical energy storage market in Europe. With over 6,000 GWh of planned and installed electro-chemical generating capacity (~84 MW installed capacity), Italy is far ahead of 2nd place UK. This is largely due to the massive SNAC project by TERNA (Italy’s TSO), a sodium-ion battery installation totaling nearly 35 MW over three phases. A breakdown of energy storage projects, by technology type can be seen below.

Energy Storage Projects by Type (Sandia National Laboratories)

Service Uses of Energy Storage

In Italy, electrical energy storage is used almost exclusively for grid support functions; mainly transmission congestion relief (frequency regulation). While it may not be a direct case of renewables firming, congestion issues can be traced to the variability of solar power, meaning electrical energy storage development in Italy is largely driven by the need to integrate solar power.

Energy Storage by Service Use Type (Sandia National Laboratories)

Energy Storage Market Outlook

Italy is one of the top markets in the EU for energy storage and is primed for growth. The Italian TSO, TERNA, has been investigating selling energy storage as a service. In 2014 the AEEG, the electrical regulator under which TERNA operates, proposed that batteries should be treated as generation sources similar to cogeneration plants. Italy has always been a market completely dominated by a small number of big centralized utility companies and this trend is likely to continue when it comes to EES deployment. These companies have been focusing their efforts on battery technologies and are expected to continue down this path.

However, the private market could present great opportunity for P2G. The International Battery & Energy Storage Alliance have summarized the reality of Italy’s untapped energy storage market as follows: “With high solar output of 1,400 kWh/kWp, net residential electricity prices around 23 cent/kWh and currently no FIT, the Italian energy market is considered to be highly receptive for energy storage.”

Italy is now well-stocked with residential PV systems that can no longer collect subsidies. Combine this with the fact that the vast majority of homes in Italy burn natural gas imported from Russia, Libya and Algeria and it is clear that Italy presents a unique opportunity for P2G at a residential/community level. This is echoed by Energy Storage Update who in 2015 concluded that Italy was “one of the top four markets worldwide for PV-and-battery-based energy self-consumption.”

While it is unclear exactly how many residential PV systems there are in Italy, it was speculated in late 2015 that there were over 500,000 PV plants in Italy.

In our next post, we are looking at the situation for energy storage in Denmark.

(Jon Martin, 2019)

Posted on

Energy storage market in the United Kingdom

The UK’s Electricity Portfolio

In our last post about the EU energy storage market we gave a brief overview of Germany’s situation. Now, we show how the United Kingdom prepared itself for its energy transition. Traditionally, the UK’s energy mix has been dominated by fossil fuels. This remains the status quo today, as approximately 60% of the electricity generated in the UK comes from fossil fuel sources, with another 20% coming from nuclear.

UK electricity production 2015 (Source: The UK Government)

While the UK has been heavily dependent on carbon-intensive sources of electricity, in 2008 they committed to a 15% renewable energy target (by 2020) and 80% reduction in CO2 emissions (by 2050; Department of Energy & Climate Change). However, the UK has stated that they will miss the 15% renewable target for 2020, due to the lack of properly designed policy measures. There has been considerable pressure to transition to a low carbon market and with one-quarter of existing generating capacity (mainly coal and nuclear) expected to close by 2021; it is expected that growth in renewable energy will lead to more energy storage capacities.

In 2011 the UK government, acknowledging that their current market structure would not be able to accommodate the scale or rate of investment in clean energy needed, proposed a shift to a capacity-based market, that is, a market in which a central agency procures capacity years in advance, in order to adequately plan for and control future generation. The proposed market reform would help drive the transition to low carbon energy by providing renewable energy producers revenue stability through carbon pricing and feed-in-tariffs (FITs). The capacity market was operational after the first energy auctions in late 2015.

The UK has made excellent progress on its short-term clean energy goals and there is optimism that this trend will continue. Large-scale development of low carbon generation technologies such as wind and solar is expected to continue.

Energy Storage Facilities

As of late 2016, there were 27 non-PHS EES plants representing 430 MW of installed capacity in the UK (Sandia National Laboratories). The UK’s energy storage portfolio is dominated by electro-chemical based technologies (primarily lead-acid and lithium-ion battery installations). This is shown below.

Number of Existing & Planned Energy Storage Facilities in the UK, by Type (Source: Sandia National Laboratories)

The prevalence of electro-chemical technologies appears to be continuing the short-term as well; five of the seven energy storage projects currently under development in the UK are electro-chemical. While this is a rather small sample size, the decreasing costs of lithium-ion battery storage is a point of focus for the UK.

Service Uses of Energy Storage

UK Energy Storage Facilities by Service Use Type (Source: Sandia National Laboratories)

As was shown for Germany, only a very small fraction of EES facilities are dedicated to renewables capacity firming. The existing EES capacity is almost exclusively dedicated to critical transmission support (on-site power). While nearly all of the EES capacity under development is dedicated to bulk energy storage (electric energy time shift).

There is still considerable uncertainty around the growth of EES in the UK, and with such a small sample size it is difficult to infer any correlation from the data in the figure above. According to the previous UK government, however, being geographically isolated and a net importer of electricity, one would expect the UK to place a heavier focus on renewables capacity firming in the long-term.

Energy Storage Market Outlook

The UK is in the midst of a major restructuring of their electricity generating portfolio and the market under which these assets operate. With a large portion of the existing capacity due for retirement in the next 10-15 years, the UK faces challenges in meeting energy needs while balancing decarbonization efforts. As part of this, major investment is needed in all areas of the electrical grid, including energy storage.

In its Smart Power publication, the National Infrastructure Commission outlined that while the UK is being faced with challenges to cover aging infrastructure this represents an opportunity to build efficient and flexible energy infrastructure. The Commission stated that energy storage was one of the three key innovations for a “smart power revolution”.

Many other official government bodies have expressed similar thoughts regarding energy storage. In its Low carbon network infrastructure report, the Energy and Climate Change Committee stated that “storage technologies should be deployed at scale as soon as possible”, while urging the Government to eliminate the outdated and unfair regulations that have been handcuffing energy storage development in the UK (Garton and Grimwood).

In April 2016, the Government acknowledged concerns regarding the regulatory hurdles facing energy storage projects (primarily double-charging of network charges) and stated that they would begin working with the National Infrastructure Commission and ECCC to investigate the issue. While there may be regulatory hurdles hindering energy storage in the UK, the Government has shown commitment through funding. Since 2012, the government has contributed over £80 million to energy storage research. In addition to this, the Department of Energy and Climate Change have developed a new £20 million fund to help drive innovation in energy storage technologies.

Overall, the outlook for energy storage in the UK is positive. There is considerable pressure to begin developing energy storage facilities at scale from not only industry, but also many government bodies. Investors are ready as well. As stated by the National Infrastructure Commission: “businesses are already queuing up to invest”.

Simply put: regulatory hurdles are holding back growth in the UK energy storage market. With the Government making major strides in renewable energy development and being vocal about its commitment to making the UK a leader in energy storage technology, these regulatory hurdles will likely be relaxed and there should be considerable growth in the UK energy storage market in the near-term.

At this point, specific technology types and service uses have not been hypothesized in detail. However, with the UK being geographically isolated and a net importer of electricity, logic would suggest an emphasis on renewables capacity firming in the long-term to maximize domestic consumption of renewable energy. Rapidly decreasing costs in electro-chemical technologies, coupled with the fact that much of the existing gas-fired capacity will be reaching end of life by 2030 suggest that the UK EES market would not be ideal for P2G technologies.

In our next post, we focus on Italy.

(Jon Martin, 2019)

Posted on

Energy storage market in Germany

Germany’s electricity portfolio

In our last posts we introduced electrical energy storage (EES) and the EU market for EES. Now, we focus on some important EU members, beginning with Germany. The country’s electrical energy portfolio reflects its status among the most progressive countries in the world in terms of climate action. As of November 2016, Germany had produced ~35% of its 2016 electricity needs from renewable sources as outlined in the Figure below.

Electricity Production in Germany (Source: Fraunhofer ISE)

The growth of renewable energy has been driven by Germany’s strong energy transition policy – the “Energiewende” – a long-term plan to decarbonize the energy sector. The policy was enacted in late 2010 with ambitious GHG reduction and renewable energy targets for 2050 (80-95% reduction on 1990 GHG levels and 80% renewable-based electricity).
A major part of the 2010 Energiewende policy was the reliance on Germany’s 17 nuclear power plants as a “shoulder fuel” to help facilitate the transition from fossil fuels to renewables. In light of the Fukushima disaster just six months after the enactment of the Energiewende, the German government amended the policy to include an aggressive phase-out of nuclear by 2022 while maintaining the 2050 targets. This has only magnified the importance of clean, reliable electricity from alternative sources like wind and solar.

Existing Energy Storage Facilities

As of late 2016, there is 1,050 MW of installed (non-PHS) energy storage capacity in Germany. The majority of this capacity is made up of electro-mechanical technologies such as flywheels and compressed air energy storage (CAES; see figure below).

Capacities of EES Types in Germany (Source: Sandia National Laboratories)

However, these numbers are somewhat skewed based on the fact that the electro-mechanical category is essentially two large capacity CAES plants. In reality, electro-chemical projects (mainly batteries) are much more prevalent and represent the vast majority of growth in the German storage market. There are currently 11 electro-chemical type energy storage projects under development in Germany and no electro-mechanical projects under development (see figure below).

Number of EES Projects by Type (Sandia National Laboratories)

Services Uses of Energy Storage

As outlined earlier, there are a multitude of service uses for EES technologies. Currently the existing EES fleet in Germany serves grid operations and stability applications (black start, electric supply capacity), and on-site power for critical transmission infrastructure. A breakdown of service uses in the German market is shown below.

Service Uses of Energy Storage Facilities in Germany (Sandia National Laboratories)

Most notable in is the fact that renewables capacity firming only represents 0.3% of EES currently operating in Germany, excluding pumped hydro storage. In order to understand this, it must be noted that Germany is a net exporter of electricity (next figure below). Having one of the most reliable electrical grids in the world and an ideal geographical location give Germany excellent interconnection to a variety of neighboring power markets; making it easy to export any excess electricity.

This “export balancing” is a primary reason why the EES market has not seen similar growth as renewable energy in Germany − it is easy for Germany to export power to balance the system load during periods of peak renewable production. However, there are negative aspects of this energy exporting such as severe overloading of transmission infrastructure in neighboring countries.

Net Exports of Electricity with Average Day-Ahead Market Pricing for Germany in 2015 (Source: Fraunhofer ISE)

Energy Storage Market Outlook

Logic seems to indicate that with aggressive renewable energy targets, a nuclear phase-out, and increased emphasis on energy independence Germany will need to develop more EES capacity. However, many have conjectured that the lagging expansion of EES in the short and medium term will not pose a barrier to the Energiewende. In fact, some claim that EES will not be a necessity in the next 10-20 years. For example, even when Germany reaches its 2020 wind and solar targets (46 GW and 52 GW, respectively), these would generally not exceed 55 GW of supply and nearly all of this power will be consumed domestically in real-time. Thus, no significant support from EES would be required.

The German Institute for Economy Research echos these sentiments and argue that the grid flexibility needed with significant renewable energy capacity could be provided by more cost-effective options like flexible base-load power plants and better demand side management. Additionally, innovations in power-to-heat technologies which would use surplus wind and solar electricity to feed district heating systems present significant opportunity, while creating a new market of energy service companies.

Power-to-Gas

Germany’s Federal Ministry of Transport and Digital Infrastructure found that P2G is ideally suited for turning excess renewable energy into a diverse product that can be stored for long periods of time and Germany has been the central point for P2G technology development in recent years. There are currently seven P2G projects either operating or under construction in Germany.

While there is work being done, economically feasible production of P2G is currently not achievable due to limited excess electricity and low guaranteed capacity. This limited excess electricity, is an example of the effect of power exports discussed earlier. While there may not be a significant commercial market in the short-term, introduction of P2G for transport could act as an additional driver behind continued renewable energy development in Germany.

In our next post, we cover the energy storage market of the United Kingdom.

(Jon Martin, 2019)

Posted on

Framework for a global carbon budget

Over the past decade, numerous studies have shown that global warming is roughly proportional to the concentration of CO2 in our atmosphere. In this way one can estimate our remaining carbon budget. This is the total amount of man-made carbon dioxide that can still be released into the atmosphere before reaching a set global temperature limit. The nations of the world agreed on this limit in the 2015 Paris Agreement. It should not exceed 1.5°C, and in any case be well below 2.0°C. However, diverging estimates have been made for the remaining carbon budget, which has a negative impact on policy-making. Now, an international research group of renown climate experts has published a framework for the calculation of the global CO2 budget in Nature. The researchers suggest that the application of this framework should help to overcome the differences when estimating the carbon budget, which will help to reduce uncertainties in research and policy.

Since the fifth report of the Intergovernmental Panel on Climate Change (IPCC), the concept of a carbon budget has become more important as an instrument for guiding climate policy. Over the past decade, a series of studies  has clarified why the increase in the global average temperature is roughly proportional to the total amount of CO2 emissions caused by human activity since the Industrial Revolution. In the framework, the research group cites numerous published documents that provide evidence for the linearity of this correlation. This literature has allowed scientists to define the linear relationship between warming and CO2 emissions as a transient climate response to cumulative CO2 emissions (TCRE). The linearity is an appealing concept because of the complexity of the Earth’s response to our CO2 emissions. Additional processes that affect future warming have been included in recent models, among them, for example, the thawing of the Arctic permafrost. These additional processes increase the uncertainty of current climate  models. In addition, global warming is not just caused by CO2 emissions. Other greenhouse gases, such as methane, fluorinated gases or nitrous oxide, as well as aerosols and their precursors affect global temperatures. This further complicates the relationship between future CO2.

In the case of global warming caused by CO2, every tonne contributes to warming, whether that ton is emitted in future, now or in the last century. This means that global CO2 emissions must be reduced to zero, and then remain zero. This also means that the more we emit in the next years, the faster we have to reduce our emissions later. At zero emissions, warming would stabilize, but not disappear. It may also reverse. An overdraft of the carbon budget would have to be compensated by removing the CO2 later. One way of removing CO2 from the atmosphere would be a technology called direct air capture, which we reported earlier. Ultimately, this will probably be the only way left, as carbon neutral renewable energy source sources only make up 5% of our energy mix. Establishing a global carbon budget will further highlights the urgency of our clean energy transition. Unfortunately, there is a large divergence when it comes the amount of the CO2 remaining in our carbon budget. In their framework, the researchers cite numerous studies on carbon budgets to maintain our 1.5°C target. Starting 2018, these range from 0 tonnes of CO2 to 1,000 gigatons. For the 2.0°C target, our carbon budget ranges from around 700 gigatons to nearly 2,000 gigatons of remaining CO2 emissions. The aim of the researchers is to limit this uncertainty by establishing a budget framework. The central element is the equation for calculating the remaining carbon budget:

Blim = (TlimThistTnonCO2Thist) / TCRE − EEsfb

The budget of the remaining CO2 emissions (Blim) for the specific temperature limit (Tlim) is a function of five terms that represent aspects of the geophysical and human-environment systems: the historical man-made warming (Thist), the non-CO2 contribution to the future temperature increase (TnonCO2), the zero emission commitment (TZEC), the TCRE, and an adaptation for sources from possible unrepresented Earth system feedback (EEsfb).


Term Key choices or uncertainties Type Level of understanding
Temperature limit Tlim Choice of temperature metrics that allow global warming, the choice of pre-industrial reference and consistency with global climate targets Choice Medium to high
Historical man-made warming Thist Incomplete data and methods for estimating the man-made component; see also Tlim Choice and uncertainty Medium to high
Non-CO2 contribution to future global warming TnonCO2 The level of non-CO2 contributions coinciding with global net zero CO2 emissions; depends on policy choices, but also on the uncertainty of their implementation Choice and uncertainty Medium
Non-CO2 contribution to future global warming TnonCO2 Climate reaction to non-CO2 forcers, such as aerosols and methane Uncertainty Low to medium
Zero-emissions commitment TZEC The extent of the decadal zero emission commitment and near-zero annual carbon emissions Uncertainty Low
Transient climate response to cumulative emissions of CO2 TCRE TCRE uncertainty, linearity and cumulative CO2 emissions that affect temperature metrics of the TCRE estimate Uncertainty Low to medium
Transient climate response to cumulative emissions of CO2 TCRE Uncertainty of the TCRE linearity, value and distribution beyond peak heating which is affected by cumulative CO2 emissions reduction
Uncertainty Low
Unrepresented Earth system feedback mechanisms EEsfb Impact of permafrost thawing and duration as well as methane release from wetlands on geomodels and feedback Uncertainty Very low

In the CO2 budget, the unrepresented Earth system feedback (EEsfb) is arguably the greatest uncertainty. These feedback processes are typically associated with the thawing of permafrost and the associated long-term release of CO2 and CH4. However, other sources of feedback have been identified as well. This include, for example, the variations of CO2 uptake by the vegetation and the associated nitrogen availability. Further feedback processes involve changes in surface albedo, cloud cover, or fire conditions.

It remains a challenge to adequately characterize the uncertainties surrounding the estimates of our carbon budget. In some cases, the reason of these uncertainties is inaccurate knowledge of the underlying processes or inaccurate measurements. In other cases the terminology is used inconsistently. For better comparability and flexibility, the researchers propose to routinely measure global surface air temperature values. This method gives robust data for models and model runs over selected time periods. More detailed comparisons between published estimates of the carbon budget are currently difficult because the original data used for publication often are missing. The researchers therefore propose to provide these in the future along with publications.

Breaking down the carbon budget into its individual factors makes it possible to identify a number of promising pathways for future research. One area of ​​research that might advance this field is to look more closely at the TCRE. Future research is expected to narrow down the range of TCRE uncertainties. Another promising area of ​​research is the study of the correlation between individual factors and their associated uncertainties, for example, between uncertainties in Thist and TnonCO2. This could be achieved by developing methods that allow a more reliable estimate of historical human-induced warming. It is also clear that less complex climate models are useful to further reduce the uncertainties of climate models, and hence the carbon budget. Currently, each factor of the framework presented by yhr researchers has its own uncertainties, and there is no method to formally combine them.

At Frontis Energy, too, we think that progress in these areas would improve our understanding of the estimates of our carbon budget. A systematic understanding of the carbon budget and is crucial for effectively addressing global warming challenges.

Posted on

Cheap, high-octane biofuel discovered

Researchers from the National Renewable Energy Laboratory (NREL) have developed a cheap method for producing high-octane gasoline from methanol. They recently published their method in the journal Nature Catalysis. Methanol can be synthesized from CO2 via various routes, as we reported last year. Biomass, such as wood, is one possibility.

The production of biofuels from wood, however, is too expensive to compete with fossil fuels. To find a solution to this problem, the researchers combined their basic research with an economic analysis. The researchers initially aimed at the most expensive part of the process. Thereafter, the researchers found methods to reduce these costs with methanol as an intermediate.

So far, the cost of converting methanol to gasoline or diesel was about $1 per gallon. The researchers have now reached a price of about $0.70 per gallon.

The catalytic conversion of methanol into gasoline is an important research area in the field of CO2 recovery. The traditional method is based on multi-stage processes and high temperatures. It is expensive, producing low quality fuel in small quantities. Thus, it is not competitive with petroleum-based fuels.

Hydrogen deficiency was the initially problem the researcher had to overcome. Hydrogen is the key energy containing element in hydrocarbons. The researchers hypothesized that using the transition metal copper would solve this problem, which it did. They estimated that the copper-infused catalyst resulted in 38% more yield at lower cost.

By facilitating the reintegration of C4 byproducts during the homologation of dimethyl ether, the copper zeolite catalyst enabled this 38% increase in product yield and a 35% reduction in conversion cost compared to conventional zeolite catalysts. Alternatively, C4 by-products were passed to a synthetic kerosene meeting five specifications for a typical jet fuel. Then, the fuel synthesis costs increased slightly. Even though the cost savings are minimal, the resulting product has a higher value.

Apart from the costs, the new process offers users further competitive advantages. For example, companies can compete with ethanol producers for credits for renewable fuels (if the carbon used comes from biogas or household waste). The process is also compatible with existing methanol plants that use natural gas or solid waste to produce syngas.

Posted on

Ammonia energy storage #3

As a loyal reader or loyal reader of our blog, you will certainly remember our previous publications on ammonia energy storage. There, we describe possible ways to extract ammonia from the air, as well as the recovery of its energy in the form of methane (patent pending WO2019/079908A1). Since global food production requires large amounts of ammonia fertilizers, technologies for extraction from air is already very mature. These technologies are essentially all based on the Haber-Bosch process, which was industrialized at the beginning of the last century. During this process, atmospheric nitrogen (N2) is reduced to ammonia (NH3). Despite the simplicity of the molecules involved, the cleavage of the strong nitrogen−nitrogen bonds in N2 and the resulting nitrogen−hydrogen bonds pose a major challenge for catalytic chemists. The reaction usually takes place under harsh conditions and requires a lot of energy, i.e. high reaction temperatures, high pressures and complicated combinations of reagents, which are also often expensive and energy-intensive to manufacture.

Now, a research group led by Yuya Ashida has published an article in the renowned journal Nature, in which they show that a samarium compound in aqueous solution combined with a molybdenum catalyst can form ammonia from atmospheric nitrogen. The work opens up new possibilities in the search for ways to ammonia synthesis under ambient conditions. Under such conditions, less energy is required to produce ammonia, resulting in higher energy efficiency for energy storage. In today’s Haber-Bosch process, air and hydrogen gas are combined via an iron catalyst. The resulting global ammonia production of this process ranges from 250 to 300 tonnes per minute, delivering fertilizers that provide nearly 60% of the world’s population (The Alchemy of Air, available at Amazon).

Comparison of different approaches to produce ammonia. Top: In the industrial Haber-Bosch synthesis of ammonia (NH3), nitrogen gas (N2) reacts with hydrogen molecules (H2), typically in the presence of an iron catalyst. The process requires high temperatures and pressures, but is thermodynamically ideal because only little energy is wasted on side reactions. Center: Nitrogenase enzymes catalyze the reaction of six-electron (e) nitrogen and six protons (H+) under ambient conditions to form ammonia. However, two additional electrons and protons form one molecule of H2. The conversion of ATP (the biological energy “currency”) into ADP drives the reaction. This reaction has a high chemical overpotential. It consumes much more energy than is needed for the actual ammonia forming reaction. Bottom: In the new reaction proposed by Ashida and colleagues, a mixture of water and samarium diiodide (SmI2) is converted to ammonia using nitrogen under ambient conditions and in the presence of a molybdenum catalyst. SmI2 weakens the O−H bonds of the water and generates the hydrogen atoms, which then react with atmospheric nitrogen.

On industrial scale, ammonia is synthesized at temperatures that exceed 400°C and pressures of approximately 400 atmospheres. These conditions are often referred to as “harsh”. During the early days, these harsh conditions were difficult to control. Fatal accidents were not uncommon in the early years of the Haber-Bosch development. This has motivated many chemists to find “milder” alternatives. After all, this always meant searching for new catalysts to lower operating temperatures and pressures. The search for new catalysts would ultimately reduce capital investment in the construction of new fertilizer plants. Since ammonia synthesis is one of the largest producers of carbon dioxide, this would also reduce the associated emissions.

Like many other chemists before them, the authors have been inspired by nature. Nitrogenase enzymes carry out the biological conversion of atmospheric nitrogen into ammonia, a process called nitrogen fixation. On recent Earth, this process is the source of nitrogen atoms in amino acids and nucleotides, the elemental building blocks of life. In contrast to the Haber-Bosch process, nitrogenases do not use hydrogen gas as a source of hydrogen atoms. Instead, they transfer protons (hydrogen ions, H+) and electrons (e) to each nitrogen atom to form N−H bonds. Although nitrogenases fix nitrogen at ambient temperature, they use eight protons and electrons per molecule N2. This is remarkable because the stoichiometry of the reaction requires only six each. This way, nitrogenases provide the necessary thermodynamic drive for nitrogen fixation. The excess of hydrogen equivalents means that nitrogenases have a high chemical overpotential. That is, they consume much more energy than would actually be needed for nitrogen fixation.

The now published reaction is not the first attempt to mimic the nitrogenase reaction. In the past, metal complexes were used with proton and electron sources to convert atmospheric nitrogen into ammonia. The same researchers have previously developed 8 molybdenum complexes that catalyze nitrogen fixation in this way. This produced 230 ammonia molecules per molybdenum complex. The associated overpotentials were significant at almost 1,300 kJ per mole nitrogen. In reality, however, the Haber-Bosch process is not so energy-intensive given the right catalyst is used.

The challenge for catalysis researchers is to combine the best biological and industrial approaches to nitrogen fixation so that the process proceeds at ambient temperatures and pressures. At the same time, the catalyst must reduce the chemical overpotential to such an extent that the construction of new fertilizer plants no longer requires such high capital investments. This is a major challenge as there is no combination of acids (which serve as a proton source) and reducing agents (the electron sources) available for the fixation at the thermodynamic level of hydrogen gas. This means that the mixture must be reactive enough to form N−H bonds at room temperature. In the now described pathway with molybdenum and samarium, the researchers have adopted a strategy in which the proton and electron sources are no longer used separately. This is a fundamentally new approach to catalytic ammonia synthesis. It makes use of a phenomenon known as coordination-induced bond weakening. In the proposed path, the phenomenon is based on the interaction of samarium diiodide (SmI2) and water.

Water is stable because of its strong oxygen-hydrogen bonds (O−H). However, when the oxygen atom in the water is coordinated with SmI2, it exposes its single electron pair and its O−H bonds are weakened. As a result, the resulting mixture becomes a readily available source of hydrogen atoms, protons and electrons, that is. The researchers around Yuya Ashida use this mixture with a molybdenum catalyst to fix nitrogen. SmI2-water mixtures are therefore particularly suitable for this type of catalysis. In them, a considerable coordination-induced bond weakening was previously measured, which was used inter alia for the production of carbon-hydrogen bonds.

The extension of this idea to catalytic ammonia synthesis is remarkable for two reasons. First, the molybdenum catalyst facilitates ammonia synthesis in aqueous solution. This is amazing because molybdenum complexes in water are usually degraded. Second, the use of coordination-induced bond weakening provides a new method for nitrogen fixation at ambient conditions. This also avoids the use of potentially hazardous combinations of proton and electron sources which are a fire hazard. The authors’ approach also works when ethylene glycol (HOCH2CH2OH) is used instead of water. Thus, the candidates for proton and electron sources are extended by an additional precursor.

Ashida and colleagues propose a catalytic cycle for their process in which the molybdenum catalyst initially coordinates to nitrogen and cleaves the N−N bond to form a molybdenum nitrido complex. This molybdenum nitrido complex contains the molybdenum-nitrogen triple bond. The SmI2-water mixture then delivers hydrogen atoms to this complex, eventually producing ammonia. The formation of N−H bonds with molybdenum nitrido complexes represents a significant thermodynamic challenge since the N−H bonds are also weakened by the molybdenum. Nevertheless, the disadvantages are offset by the reduction of the chemical overpotential. The SmI2 not only facilitates the transfer of hydrogen atoms, but also keeps the metal in a reduced form. This prevents undesired molybdenum oxide formation in aqueous solution.

The new process still has significant operational hurdles to overcome before it can be used on an industrial scale. For example, SmI2 is used in large quantities, which generates a lot of waste. The separation of ammonia from aqueous solutions is difficult in terms of energy consumption. However, if the process were used for energy storage in combination with our recovery method, the separation would be eliminated from the aqueous solution. Finally, there is still a chemical overpotential of about 600 kJ/mol. Future research should focus on finding alternatives to SmI2. These could be based, for example, on metals that occur more frequently than samarium and promote coordination-induced bond weakening as well. As Fritz Haber and Carl Bosch have experienced, the newly developed method will probably take some time for development before it becomes available on industrial scale.

(Photo: Wikipedia)

Posted on

Melting ice sheets in Greenland contribute 25% to sea level rise

Recently we reported the loss of snow cover in Europe. The snow is not only gone in many parts of Europe, also Greenland’s ice cover is melting. The Greenland ice sheet contributes 25% to global sea-level rise. This makes it the largest contribution of the cryosphere. The increased mass loss of Greenland ice during the 21st century is mainly due to the increased surface water runoff, of which ~93% come directly from the small ablation zone of the ice sheet (~22% of the ice surface). As the snow melts in the summer, bare glacier ice is more exposed in this ablation zone. Naked ice is darker and less porous than snow. It absorbs more than twice the solar radiation while also holding back less meltwater. Smooth ice produces a large proportion (~78%) of the total outflow of Greenland into the sea, although in summer only a small area of ​​the ice is exposed. Accurately capturing the reduced albedo and the full extent of bare ice in climate models is critical to determining Greenland’s present and future runoff contribution to sea-level rise.

The mass loss of the Greenland ice sheet has recently increased due to the accelerated melting of its surface. As this melting is critically affected by surface albedo, understanding the processes and potential feedbacks regardinng the albedo is required for accurately forecasting mass loss. The resulting radiation variability of the ablation zone caused the ice layer to melt five times faster compared with hydrological and biological processes, which also darken the ice sheet. Variations in the snow limits due to the shallower ice layer at higher altitudes have an even greater impact on melt when the climate is warmer. As a result of these fluctuations, the mapped ice surface during the summer of 2012, the record year of snowmelt, was the largest and had an area of 300,050 km2. That is, bare ice accounted for 16% of the ice surface. The smallest extent of bare ice was 184,660 km2 and was observed in 2006. This corresponded to 10% of the ice surface, i.e. almost 40% less area than in 2012. However, the observed snowpack variation was high and the observation period was too short for a solid trend assessment.

Current climate models are too inaccurate in predicting the sea level rise during flood years, leading to uncertainty in the estimation of Greenland’s contribution to global sea level rise. To understand the factors that influence melting, Jonathan Ryan of Brown University, Providence, Rhode Island, and his colleagues have investigated Greenland’s snow line. At altitudes below the snow line, the darker ice is not covered by snow. This snow line moves up or down during Greenland’s seasons. The researchers mapped these movements between 2001 and 2017 using satellite images. The average height of the snow line at the end of the summer in 2009 was between 1,330 m and then 1,650 m in 2012. The fluctuations in the snow line are the most important factor when it comes to how much solar energy the ice sheet absorbs. Modelers must consider this effect to improve their predictions. Knowing how much and how fast the Greenland ice melts will help us to take better protective measures. At Frontis Energy, we think that the best protection against sea-level rise is the prevention and recycling of CO2.

(Photo: Wikipedia)

Posted on

Producing liquid bio-electrically engineered fuels from CO2

At Frontis Energy we have spent much thought on how to recycle CO2. While high value products such as polymers for medical applications are more profitable, customer demand for such products is too low to recycle CO2 in volumes required to decarbonize our atmosphere to pre-industrial levels. Biofuel, for example from field crops or algae has long been thought to be the solution. Unfortunately, they require too much arable land. On top of their land use, biochemical pathways are too complex to understand by the human brain. Therefore, we propose a different way to quickly reach the target of decarbonizing our planet. The proce­dure begins with a desired target fuel and suggests a mi­crobial consortium to produce this fuel. In a second step, the consortium will be examined in a bio-electrical system (BES).

CO2 can be used for liquid fuel production via multiple pathways. The end product, long-chain alcohols, can be used either directly as fuel or reduced to hydrocarbons. Shown are examples of high level BEEF pathways using CO2 and electricity as input and methane, acetate, or butanol as output. Subsequent processes are 1, aerobic methane oxida­tion, 2, direct use of methane, 3 heterotrophic phototrophs, 4, acetone-butanol fermentation, 5, heterotrophs, 6, butanol di­rect use, 7, further processing by yeasts

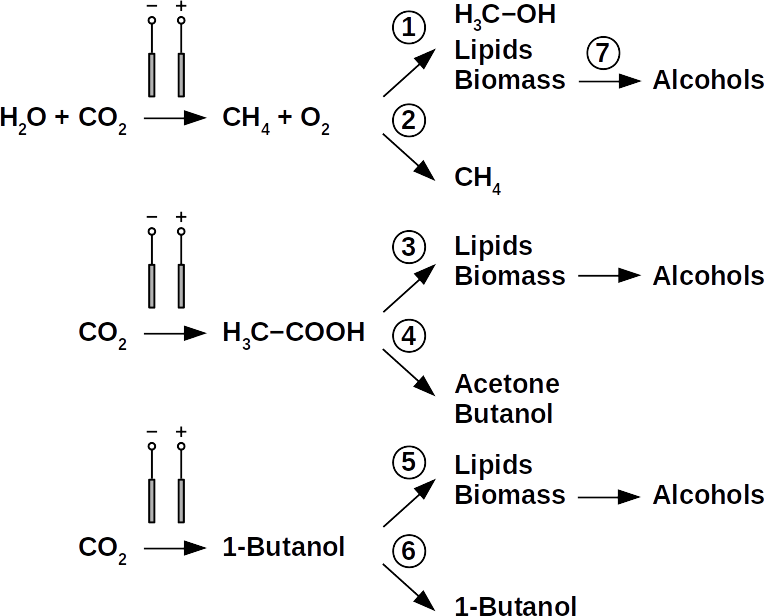
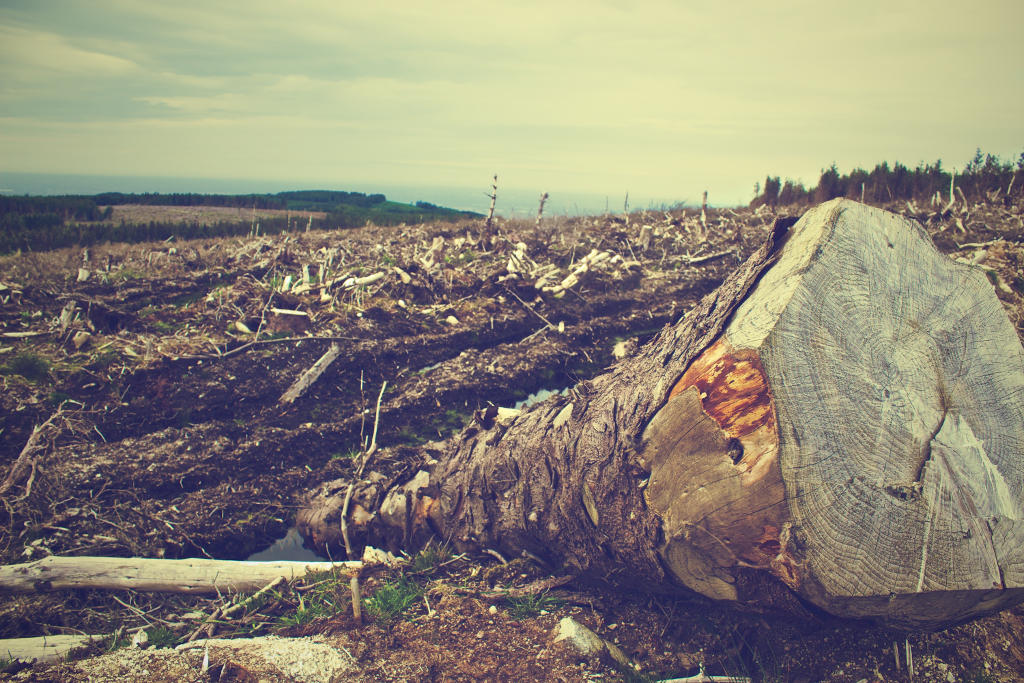
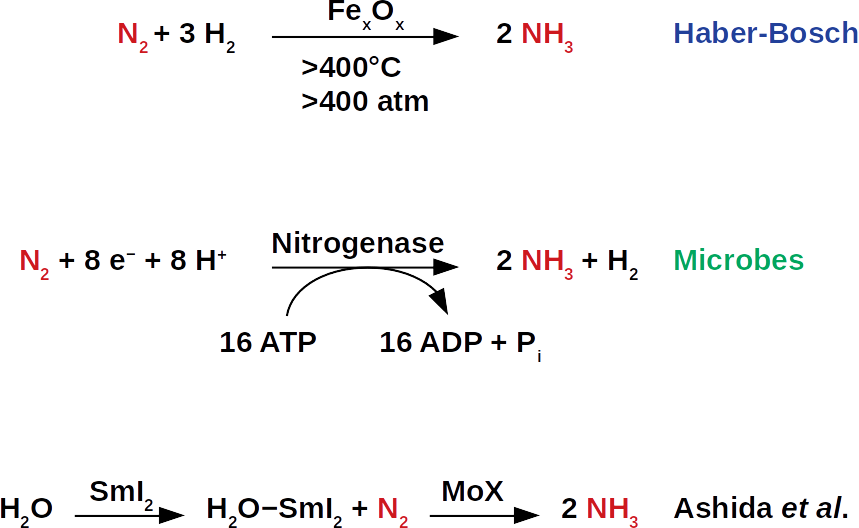
Today’s atmospheric CO2 imbalance is a consequence of fossil carbon combus­tion. This real­ity requires quick and pragmatic solutions if further CO2 accu­mulation is to be prevented. Direct air capture of CO2 is moving closer to economic feasibility, avoid­ing the use of arable land to grow fuel crops. Producing combustible fuel from CO2 is the most promis­ing inter­mediate solution because such fuel integrates seamlessly into existing ur­ban in­frastructure. Biofuels have been ex­plored inten­sively in re­cent years, in particular within the emerging field of syn­thetic biol­ogy. How­ever tempt­ing the application of genetically modified or­ganisms (GMOs) ap­pears, non-GMO technology is easier and faster to im­plement as the re­quired microbial strains al­ready exist. Avoiding GMOs, CO2 can be used in BES to produce C1 fu­els like methane and precursors like formic acid or syngas, as well as C1+ com­pounds like ac­etate, 2-oxybut­yrate, bu­tyrate, ethanol, and butanol. At the same time, BES inte­grate well into urban in­frastructure without the need for arable land. However, except for meth­ane, none of these fuels are readily com­bustible in their pure form. While elec­tromethane is a com­mercially avail­able al­ternative to fossil natu­ral gas, its volumetric energy den­sity of 40-80 MJ/m3 is lower than that of gasoline with 35-45 GJ/m3. This, the necessary technical modifications, and the psychological barrier of tanking a gaseous fuel make methane hard to sell to automobilists. To pro­duce liq­uid fuel, carbon chains need to be elongated with al­cohols or better, hy­drocarbons as fi­nal prod­ucts. To this end, syngas (CO + H2) is theoreti­cally a viable option in the Fischer-Tropsch process. In reality, syngas pre­cursors are ei­ther fossil fu­els (e.g. coal, natural gas, methanol) or biomass. While the for­mer is ob­viously not CO2-neu­tral, the latter com­petes for arable land. The di­rect con­version of CO2 and electrolytic H2 to C1+ fuels, in turn, is catalyzed out by elec­troactive microbes in the dark (see title figure), avoid­ing food crop com­petition for sun-lit land. Unfortunately, little re­search has been under­taken beyond proof of con­cept of few electroactive strains. In stark con­trast, a plethora of metabolic studies in non-BES is avail­able. These studies often pro­pose the use of GMOs or complex or­ganic sub­strates as precur­sors. We propose to systemati­cally identify metabolic strategies for liquid bio-electrically engineered fuel (BEEF) production. The fastest approach should start by screening meta­bolic data­bases using es­tablished methods of metabolic modeling, fol­lowed by high throughput hypothesis testing in BES. Since H2 is the intermediate in bio-electrosynthesis, the most efficient strategy is to focus on CO2 and H2 as di­rect pre­cursors with as few in­termediate steps as pos­sible. Scala­bility and energy effi­ciency, eco­nomic feasibil­ity that is, are pivotal elements.

First, an electrotrophic acetogen produces acetate, which then used by heterotrophic algae in a consecutive step.

The biggest obstacle for BEEF production is lacking knowledge about pathways that use CO2 and electrolytic H2. This gap exists despite metabolic data­bases like KEGG and more recently KBase, making metabolic design and adequate BEEF strain selection a guessing game rather than an educated ap­proach. Nonetheless, metabolic tools were used to model fuel pro­duction in single cell yeasts and various prokaryotes. In spite of their shortcomings, metabolic data­bases were also employed to model species interactions, for example in a photo-het­erotroph consor­tium using software like ModelSEED / KBase (http://mod­elseed.org/), RAVEN / KEGG and COBRA. A first sys­tematic at­tempt for BEEF cul­tures produci­ng acetate demonstrated the usability of KBase for BES. This research was a bottom-up study which mapped ex­isting genomes onto existing BEEF consor­tia. The same tool can also be em­ployed in a top-down ap­proach, starting with the desired fuel to find the re­quired or­ganisms. Some possi­ble BEEF organisms are the following.

Possible pathways for BEEF production involving Clostridium, 3, or heterotrophic phototrophs, 7, further processing by yeasts

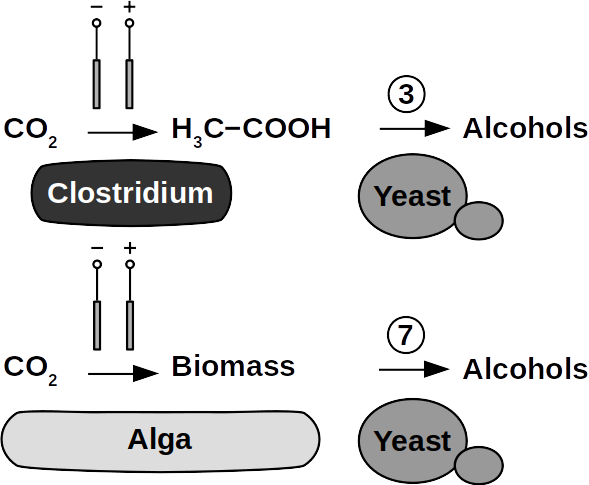
Yeasts are among the microorganisms with the greatest potential for liquid biofuel production. Baker’s yeast, (Saccha­romyces cerevisiae) is the most promi­nent exam­ple. While known for ethanol fermentat­ion, yeasts also produce fusel oils such as bu­tane, phenyl, and amyl derivate aldehy­des and alco­hols. Unlike ethanol, which is formed via sugar fer­mentation, fusel oil is syn­thesized in branched-off amino acid pathways followed by alde­hyde reduction. Many en­zymes involved in the re­duction of aldehydes have been identified, with al­cohol dehydro­genases be­ing the most commonly ob­served. The corre­sponding reduc­tion reactions require reduced NADH⁠ but it is not known whether H2 pro­duced on cathodes of BES can be in­volved.
Clostridia, for example Clostridium acetobutylicum and C. carboxidivo­rans, can pro­duce alcohols like butanol, isopropanol, hexanol, and ketones like acetone from complex sub­strates (starch, whey, cel­lulose, etc. ) or from syngas. Clostridial me­tabolism has been clarified some time ago and is dif­ferent from yeast. It does not necessar­ily require com­plex precursors for NAD+ reduction and it was shown that H2, CO, and cath­odes can donate elec­trons for alcohol production. CO2 and H2 were used in a GMO clostridium to produce high titers of isobu­tanol. Typi­cal representa­tives for acetate produc­tion from CO2 and H2 are C. ljungdahlii, C. aceticum, and Butyribac­terium methy­lotrophicum. Sporo­musa sphaeroides pro­duces acetate in BES. Clostridia also dominated mixed cul­ture BESs converting CO2 to butyrate. They are therefore prime targets for low cost biofuel production. Alcohols in clostridia are produced from acetyl-CoA. This reaction is re­versible, al­lowing ac­etate to serve as substrate for biofuel production with extra­cellular en­ergy sup­ply. Then, en­ergy con­servation, ATP syn­thesis that is, can be achieved from ethanol electron bifurca­tion or H2 oxida­tion via respi­ration. While pos­sible in anaero­bic clostridia, it is hitherto unknown whether elec­tron bifurca­tion or res­piration are linked to alcohols or ke­tone synthesis.
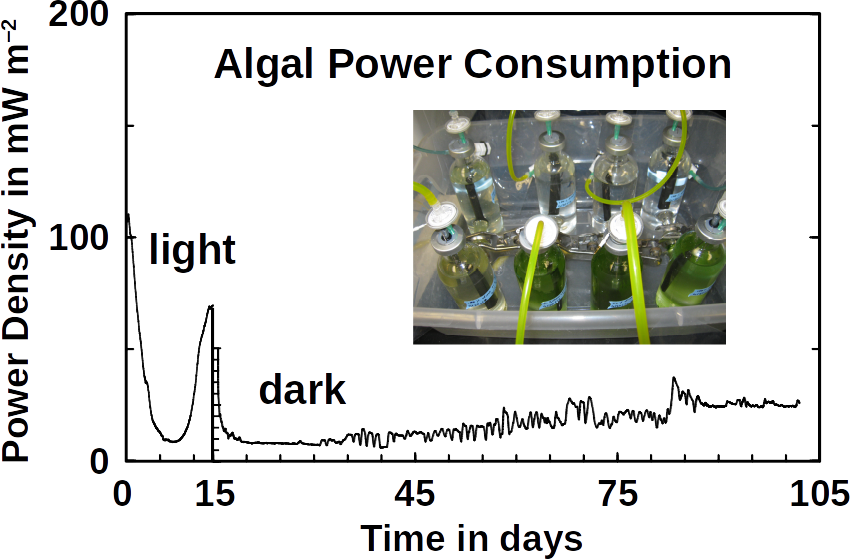
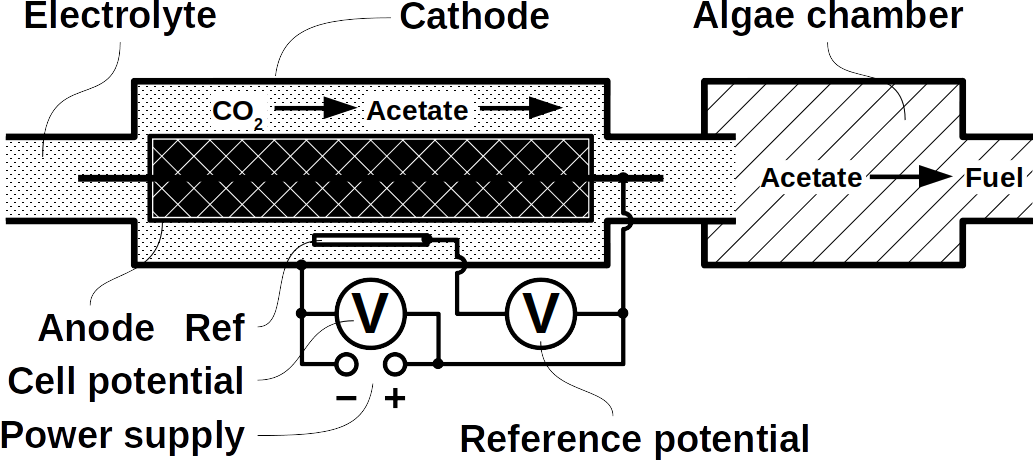
Phototrophs like Botryococcus produce C1+ biofuels as well. They synthesize a number of different hydro­carbons including high value alkanes and alkenes as well as terpenes. However, high titers were achieved by only means of ge­netic engineering, which is economically not feasible in many countries due to regulatory constrains. Moreover, aldehyde dehy­dration/deformylation to alkanes or alkenes requires molecular oxygen to be present. Also the olefin path­way of Syne­chococcus depends on molecular oxygen with the cytochrome P450 involved in fatty acid de­carboxylation. The presence of molecular oxygen affects BES performance due to immediate product degrada­tion and unwanted cathodic oxygen reduction. In contrast, our own preliminary experi­ments (see title photo) and a corrosion experi­ment show that algae can live in the dark using electrons from a cath­ode. While the en­zymes in­volved in the production of some algal biofuels are known (such as olefin and alde­hyde de­formylation), it is not known whether these pathways are connected to H2 utilization (perhaps via ferredox­ins). Such a con­nection would be a promising indicator for the possibility of growing hydrocar­bon produc­ing cyanobacteria on cathodes of BES and should be examined in future research.
At Frontis Energy we believe that a number of other microorganisms show potential for BEEF production and these deserve further investi­gation. To avoid GMOs, BES compatible co-cultures must be identified via in silico meta­bolic reconstruc­tion from existing databases. Possible inter-species intermediates are unknown but are prerequisite for suc­cessful BES operation. Finally, a techno-economical assessment of BEEF pro­duction, with and with­out car­bon taxes, and compared with chemical methods, will direct future research.