Posted on

Solid oxide fuel cells convert methane gas recovered from groundwater

Solid oxide fuel cells (SOFCs) are highly efficient energy conversion devices and have low operating costs. They work at a temperature range of 800 to 1,000 degrees Celsius. This allows for the possibility of using internal conversion of hydrocarbon fuels into hydrogen. Methane, methanol, petroleum, and other hydrocarbons can be converted to hydrogen (H2) directly within the fuel cell.

SOFCs have a number of additional advantages over traditional combustion engines or other types of fuel cells. For example, the high exhaust heat (over 800 degrees Celsius) makes them a useful application in the industry for cogeneration of electricity and heat. Because of combined cycles, high efficiency for electricity production can be achieved. In addition, due to the modular nature of SOFCs, they offer flexible planning of power generation capacity. This way, the use of SOFCs results in a further reduction of carbon dioxide emission.

The greatest advantage of SOFCs is that they can be operated with hydrocarbon fuels such as methane (CH4, the main component of natural gas). The direct use of methane eliminates the need for pre-reformers, thus reducing the complexity, size, and cost of the overall SOFC system.

Methane can be recovered from the decay of organic waste in municipal solid waste landfills, drinking water treatment plants, etc. The gas can also be recovered from groundwater because of the naturally occurring anaerobic degradation of organic matter in the subsurface or the infiltration of methane from natural gas reservoirs.

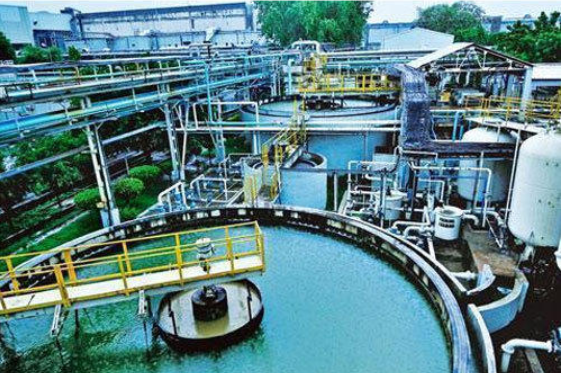
A research team from the Delft University of Technology assumed that the gas collected from groundwater treatment can be effectively used as fuel in SOFCs and put their hypothesis to a test. They published their results in the journal Journal of Cleaner Production. Currently, the methane recovered from the Drinking Water Treatment Plant (DWTP) of Spannenburg, Netherlands is either released into the atmosphere or flared, wasting a precious resource and contributing to further greenhouse emission in the form of CO2.

SOFCs provide the cleanest of the viable solutions of converting recovered methane into electrical energy, which, in turn, can be utilized by the DWTP. This process will decrease the power demands and simultaneously reduce the greenhouse gas emissions of the DWTP.

The entire process was divided into the following steps:

  1. Methane was recovered from groundwater: The groundwater was pumped from the deep-wells directly to a system of vacuum towers, which remove 90% of the dissolved gas using a near vacuum of 0.2 bar.
  2. Subsequent treatment by plate aeration was done to remove the remaining 10% of methane in the groundwater.
  3. Tower aeration used to further remove CO2 before pellet softening process to lower hardness.

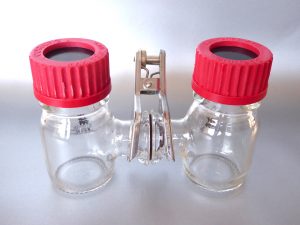
Recovered gas sampling:

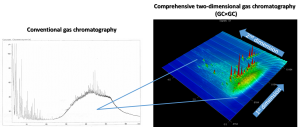
200 mL of the recovered gas enriched in methane was used to determine the concentration of CH4, H2, Oxygen (O2), nitrogen (N2), carbon monoxide (CO), and CO2.

SOFC set up & thermodynamic approach:

A SOFC test station was used to carry out the experiments. The methane rich gas was fed to the anode and the open circuit potential was logged. Methane must be reformed to hydrogen and CO before electricity can effectively be generated in an SOFC.

Results:

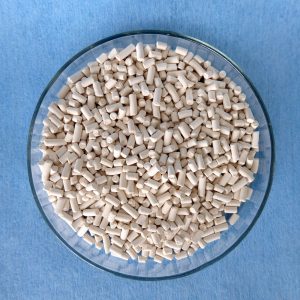
The main components in the sampled gas were methane and CO2 with concentrations of 71 and 23 mol%, respectively. Additionally, the recovered gas contained 9 ppm of hydrogen sulphide (H2S), which can permanently reduce the cell performance of an SOFC. Hydrogen sulphide was effectively removed (<0.1 ppm) with impregnated activated carbon

The use of CH4 recovered from the groundwater in an SOFC helps to mitigate the greenhouse gas emissions and improve the sustainability of DWTPs. The recovered methane gas of the Spannenburg DWTP can be used to run a 915 kW SOFC system. This can supply 51.2% of the total electrical power demand of the plant and decreases greenhouse gas emissions by 17.6%, which is around 1794 tons of CO2.

The annual power generation of the SOFC system can be 8 GWh, which is about 3 GWh more than that produced by an internal combustion engine such as a gas turbine or piston engine.

In the future, the researchers will conduct a long-term tests to determine the safe operating condition of SOFC with respect to the carbon deposition issue. These tests will be extended to the SOFC stack level and pilot plant (in the range of a few kW systems)

(Photo: Indiamart)

Reference: https://doi.org/10.1016/j.jclepro.2021.125877 (A solid oxide fuel cell fueled by methane recovered from groundwater, 2021)

Posted on

Energy storage in Italy

Italy’s Electricity Portfolio

In our previous post we briefed you on the energy storage potential in the United Kingdom. With Brexit, Italy will become the third largest member state after Germany and France. With extensive mountain terrain in the north, Italy has long been dependent upon hydroelectric generation. Until the mid 1960s hydropower represented nearly all electricity production in Italy. The installed capacity of hydropower has been stagnant since the mid 1960s, with a rapid growth in fossil fuel based generation driving the overall share of hydropower fall from ~90% to 22% in 2014. A detailed breakdown of electricity sources in Italy is shown below.

Electricity Production in Italy (2014)

Considerable effort has been made to transition Italy to a low carbon electricity sector. As of 2016, Italy had the 5th highest installed solar capacity in the world and the 2nd highest per capita solar capacity, behind only Germany. In addition to its impressive solar progress Italy ranks 6th worldwide in geothermal with 0.9 GW.

Italy’s solar growth was propelled by feed-in-tariffs that wer enacted in 2005. This provided residential PV owners with financial compensation for energy sold to the grid. However, the feed-in-tariff program ceased on 06 July 2014 after the €6.7 billion subsidy limit was reached.

Even with its impressive accomplishments in renewable energy, traditional thermal generation (natural gas) still account for ~60% of total electricity generation in Italy. How much effort will go into reducing this number is still unclear. Italy has committed to 18% renewables by 2020 and is nearly 70% of the way there already so there is little urgency on reducing fossil-based electricity from the perspective of meeting this target. However, Italy is heavily reliant on fossil fuel imports (Deloitte) and energy security requirements will likely continue to push the development of more domestic electricity sources like renewables.

Energy Storage Facilities

Italy is dominating the electro-chemical energy storage market in Europe. With over 6,000 GWh of planned and installed electro-chemical generating capacity (~84 MW installed capacity), Italy is far ahead of 2nd place UK. This is largely due to the massive SNAC project by TERNA (Italy’s TSO), a sodium-ion battery installation totaling nearly 35 MW over three phases. A breakdown of energy storage projects, by technology type can be seen below.

Energy Storage Projects by Type (Sandia National Laboratories)

Service Uses of Energy Storage

In Italy, electrical energy storage is used almost exclusively for grid support functions; mainly transmission congestion relief (frequency regulation). While it may not be a direct case of renewables firming, congestion issues can be traced to the variability of solar power, meaning electrical energy storage development in Italy is largely driven by the need to integrate solar power.

Energy Storage by Service Use Type (Sandia National Laboratories)

Energy Storage Market Outlook

Italy is one of the top markets in the EU for energy storage and is primed for growth. The Italian TSO, TERNA, has been investigating selling energy storage as a service. In 2014 the AEEG, the electrical regulator under which TERNA operates, proposed that batteries should be treated as generation sources similar to cogeneration plants. Italy has always been a market completely dominated by a small number of big centralized utility companies and this trend is likely to continue when it comes to EES deployment. These companies have been focusing their efforts on battery technologies and are expected to continue down this path.

However, the private market could present great opportunity for P2G. The International Battery & Energy Storage Alliance have summarized the reality of Italy’s untapped energy storage market as follows: “With high solar output of 1,400 kWh/kWp, net residential electricity prices around 23 cent/kWh and currently no FIT, the Italian energy market is considered to be highly receptive for energy storage.”

Italy is now well-stocked with residential PV systems that can no longer collect subsidies. Combine this with the fact that the vast majority of homes in Italy burn natural gas imported from Russia, Libya and Algeria and it is clear that Italy presents a unique opportunity for P2G at a residential/community level. This is echoed by Energy Storage Update who in 2015 concluded that Italy was “one of the top four markets worldwide for PV-and-battery-based energy self-consumption.”

While it is unclear exactly how many residential PV systems there are in Italy, it was speculated in late 2015 that there were over 500,000 PV plants in Italy.

In our next post, we are looking at the situation for energy storage in Denmark.

(Jon Martin, 2019)

Posted on

Energy storage market in the United Kingdom

The UK’s Electricity Portfolio

In our last post about the EU energy storage market we gave a brief overview of Germany’s situation. Now, we show how the United Kingdom prepared itself for its energy transition. Traditionally, the UK’s energy mix has been dominated by fossil fuels. This remains the status quo today, as approximately 60% of the electricity generated in the UK comes from fossil fuel sources, with another 20% coming from nuclear.

UK electricity production 2015 (Source: The UK Government)

While the UK has been heavily dependent on carbon-intensive sources of electricity, in 2008 they committed to a 15% renewable energy target (by 2020) and 80% reduction in CO2 emissions (by 2050; Department of Energy & Climate Change). However, the UK has stated that they will miss the 15% renewable target for 2020, due to the lack of properly designed policy measures. There has been considerable pressure to transition to a low carbon market and with one-quarter of existing generating capacity (mainly coal and nuclear) expected to close by 2021; it is expected that growth in renewable energy will lead to more energy storage capacities.

In 2011 the UK government, acknowledging that their current market structure would not be able to accommodate the scale or rate of investment in clean energy needed, proposed a shift to a capacity-based market, that is, a market in which a central agency procures capacity years in advance, in order to adequately plan for and control future generation. The proposed market reform would help drive the transition to low carbon energy by providing renewable energy producers revenue stability through carbon pricing and feed-in-tariffs (FITs). The capacity market was operational after the first energy auctions in late 2015.

The UK has made excellent progress on its short-term clean energy goals and there is optimism that this trend will continue. Large-scale development of low carbon generation technologies such as wind and solar is expected to continue.

Energy Storage Facilities

As of late 2016, there were 27 non-PHS EES plants representing 430 MW of installed capacity in the UK (Sandia National Laboratories). The UK’s energy storage portfolio is dominated by electro-chemical based technologies (primarily lead-acid and lithium-ion battery installations). This is shown below.

Number of Existing & Planned Energy Storage Facilities in the UK, by Type (Source: Sandia National Laboratories)

The prevalence of electro-chemical technologies appears to be continuing the short-term as well; five of the seven energy storage projects currently under development in the UK are electro-chemical. While this is a rather small sample size, the decreasing costs of lithium-ion battery storage is a point of focus for the UK.

Service Uses of Energy Storage

UK Energy Storage Facilities by Service Use Type (Source: Sandia National Laboratories)

As was shown for Germany, only a very small fraction of EES facilities are dedicated to renewables capacity firming. The existing EES capacity is almost exclusively dedicated to critical transmission support (on-site power). While nearly all of the EES capacity under development is dedicated to bulk energy storage (electric energy time shift).

There is still considerable uncertainty around the growth of EES in the UK, and with such a small sample size it is difficult to infer any correlation from the data in the figure above. According to the previous UK government, however, being geographically isolated and a net importer of electricity, one would expect the UK to place a heavier focus on renewables capacity firming in the long-term.

Energy Storage Market Outlook

The UK is in the midst of a major restructuring of their electricity generating portfolio and the market under which these assets operate. With a large portion of the existing capacity due for retirement in the next 10-15 years, the UK faces challenges in meeting energy needs while balancing decarbonization efforts. As part of this, major investment is needed in all areas of the electrical grid, including energy storage.

In its Smart Power publication, the National Infrastructure Commission outlined that while the UK is being faced with challenges to cover aging infrastructure this represents an opportunity to build efficient and flexible energy infrastructure. The Commission stated that energy storage was one of the three key innovations for a “smart power revolution”.

Many other official government bodies have expressed similar thoughts regarding energy storage. In its Low carbon network infrastructure report, the Energy and Climate Change Committee stated that “storage technologies should be deployed at scale as soon as possible”, while urging the Government to eliminate the outdated and unfair regulations that have been handcuffing energy storage development in the UK (Garton and Grimwood).

In April 2016, the Government acknowledged concerns regarding the regulatory hurdles facing energy storage projects (primarily double-charging of network charges) and stated that they would begin working with the National Infrastructure Commission and ECCC to investigate the issue. While there may be regulatory hurdles hindering energy storage in the UK, the Government has shown commitment through funding. Since 2012, the government has contributed over £80 million to energy storage research. In addition to this, the Department of Energy and Climate Change have developed a new £20 million fund to help drive innovation in energy storage technologies.

Overall, the outlook for energy storage in the UK is positive. There is considerable pressure to begin developing energy storage facilities at scale from not only industry, but also many government bodies. Investors are ready as well. As stated by the National Infrastructure Commission: “businesses are already queuing up to invest”.

Simply put: regulatory hurdles are holding back growth in the UK energy storage market. With the Government making major strides in renewable energy development and being vocal about its commitment to making the UK a leader in energy storage technology, these regulatory hurdles will likely be relaxed and there should be considerable growth in the UK energy storage market in the near-term.

At this point, specific technology types and service uses have not been hypothesized in detail. However, with the UK being geographically isolated and a net importer of electricity, logic would suggest an emphasis on renewables capacity firming in the long-term to maximize domestic consumption of renewable energy. Rapidly decreasing costs in electro-chemical technologies, coupled with the fact that much of the existing gas-fired capacity will be reaching end of life by 2030 suggest that the UK EES market would not be ideal for P2G technologies.

In our next post, we focus on Italy.

(Jon Martin, 2019)

Posted on

Energy storage market in Germany

Germany’s electricity portfolio

In our last posts we introduced electrical energy storage (EES) and the EU market for EES. Now, we focus on some important EU members, beginning with Germany. The country’s electrical energy portfolio reflects its status among the most progressive countries in the world in terms of climate action. As of November 2016, Germany had produced ~35% of its 2016 electricity needs from renewable sources as outlined in the Figure below.

Electricity Production in Germany (Source: Fraunhofer ISE)

The growth of renewable energy has been driven by Germany’s strong energy transition policy – the “Energiewende” – a long-term plan to decarbonize the energy sector. The policy was enacted in late 2010 with ambitious GHG reduction and renewable energy targets for 2050 (80-95% reduction on 1990 GHG levels and 80% renewable-based electricity).
A major part of the 2010 Energiewende policy was the reliance on Germany’s 17 nuclear power plants as a “shoulder fuel” to help facilitate the transition from fossil fuels to renewables. In light of the Fukushima disaster just six months after the enactment of the Energiewende, the German government amended the policy to include an aggressive phase-out of nuclear by 2022 while maintaining the 2050 targets. This has only magnified the importance of clean, reliable electricity from alternative sources like wind and solar.

Existing Energy Storage Facilities

As of late 2016, there is 1,050 MW of installed (non-PHS) energy storage capacity in Germany. The majority of this capacity is made up of electro-mechanical technologies such as flywheels and compressed air energy storage (CAES; see figure below).

Capacities of EES Types in Germany (Source: Sandia National Laboratories)

However, these numbers are somewhat skewed based on the fact that the electro-mechanical category is essentially two large capacity CAES plants. In reality, electro-chemical projects (mainly batteries) are much more prevalent and represent the vast majority of growth in the German storage market. There are currently 11 electro-chemical type energy storage projects under development in Germany and no electro-mechanical projects under development (see figure below).

Number of EES Projects by Type (Sandia National Laboratories)

Services Uses of Energy Storage

As outlined earlier, there are a multitude of service uses for EES technologies. Currently the existing EES fleet in Germany serves grid operations and stability applications (black start, electric supply capacity), and on-site power for critical transmission infrastructure. A breakdown of service uses in the German market is shown below.

Service Uses of Energy Storage Facilities in Germany (Sandia National Laboratories)

Most notable in is the fact that renewables capacity firming only represents 0.3% of EES currently operating in Germany, excluding pumped hydro storage. In order to understand this, it must be noted that Germany is a net exporter of electricity (next figure below). Having one of the most reliable electrical grids in the world and an ideal geographical location give Germany excellent interconnection to a variety of neighboring power markets; making it easy to export any excess electricity.

This “export balancing” is a primary reason why the EES market has not seen similar growth as renewable energy in Germany − it is easy for Germany to export power to balance the system load during periods of peak renewable production. However, there are negative aspects of this energy exporting such as severe overloading of transmission infrastructure in neighboring countries.

Net Exports of Electricity with Average Day-Ahead Market Pricing for Germany in 2015 (Source: Fraunhofer ISE)

Energy Storage Market Outlook

Logic seems to indicate that with aggressive renewable energy targets, a nuclear phase-out, and increased emphasis on energy independence Germany will need to develop more EES capacity. However, many have conjectured that the lagging expansion of EES in the short and medium term will not pose a barrier to the Energiewende. In fact, some claim that EES will not be a necessity in the next 10-20 years. For example, even when Germany reaches its 2020 wind and solar targets (46 GW and 52 GW, respectively), these would generally not exceed 55 GW of supply and nearly all of this power will be consumed domestically in real-time. Thus, no significant support from EES would be required.

The German Institute for Economy Research echos these sentiments and argue that the grid flexibility needed with significant renewable energy capacity could be provided by more cost-effective options like flexible base-load power plants and better demand side management. Additionally, innovations in power-to-heat technologies which would use surplus wind and solar electricity to feed district heating systems present significant opportunity, while creating a new market of energy service companies.

Power-to-Gas

Germany’s Federal Ministry of Transport and Digital Infrastructure found that P2G is ideally suited for turning excess renewable energy into a diverse product that can be stored for long periods of time and Germany has been the central point for P2G technology development in recent years. There are currently seven P2G projects either operating or under construction in Germany.

While there is work being done, economically feasible production of P2G is currently not achievable due to limited excess electricity and low guaranteed capacity. This limited excess electricity, is an example of the effect of power exports discussed earlier. While there may not be a significant commercial market in the short-term, introduction of P2G for transport could act as an additional driver behind continued renewable energy development in Germany.

In our next post, we cover the energy storage market of the United Kingdom.

(Jon Martin, 2019)

Posted on

Framework for a global carbon budget

Over the past decade, numerous studies have shown that global warming is roughly proportional to the concentration of CO2 in our atmosphere. In this way one can estimate our remaining carbon budget. This is the total amount of man-made carbon dioxide that can still be released into the atmosphere before reaching a set global temperature limit. The nations of the world agreed on this limit in the 2015 Paris Agreement. It should not exceed 1.5°C, and in any case be well below 2.0°C. However, diverging estimates have been made for the remaining carbon budget, which has a negative impact on policy-making. Now, an international research group of renown climate experts has published a framework for the calculation of the global CO2 budget in Nature. The researchers suggest that the application of this framework should help to overcome the differences when estimating the carbon budget, which will help to reduce uncertainties in research and policy.

Since the fifth report of the Intergovernmental Panel on Climate Change (IPCC), the concept of a carbon budget has become more important as an instrument for guiding climate policy. Over the past decade, a series of studies  has clarified why the increase in the global average temperature is roughly proportional to the total amount of CO2 emissions caused by human activity since the Industrial Revolution. In the framework, the research group cites numerous published documents that provide evidence for the linearity of this correlation. This literature has allowed scientists to define the linear relationship between warming and CO2 emissions as a transient climate response to cumulative CO2 emissions (TCRE). The linearity is an appealing concept because of the complexity of the Earth’s response to our CO2 emissions. Additional processes that affect future warming have been included in recent models, among them, for example, the thawing of the Arctic permafrost. These additional processes increase the uncertainty of current climate  models. In addition, global warming is not just caused by CO2 emissions. Other greenhouse gases, such as methane, fluorinated gases or nitrous oxide, as well as aerosols and their precursors affect global temperatures. This further complicates the relationship between future CO2.

In the case of global warming caused by CO2, every tonne contributes to warming, whether that ton is emitted in future, now or in the last century. This means that global CO2 emissions must be reduced to zero, and then remain zero. This also means that the more we emit in the next years, the faster we have to reduce our emissions later. At zero emissions, warming would stabilize, but not disappear. It may also reverse. An overdraft of the carbon budget would have to be compensated by removing the CO2 later. One way of removing CO2 from the atmosphere would be a technology called direct air capture, which we reported earlier. Ultimately, this will probably be the only way left, as carbon neutral renewable energy source sources only make up 5% of our energy mix. Establishing a global carbon budget will further highlights the urgency of our clean energy transition. Unfortunately, there is a large divergence when it comes the amount of the CO2 remaining in our carbon budget. In their framework, the researchers cite numerous studies on carbon budgets to maintain our 1.5°C target. Starting 2018, these range from 0 tonnes of CO2 to 1,000 gigatons. For the 2.0°C target, our carbon budget ranges from around 700 gigatons to nearly 2,000 gigatons of remaining CO2 emissions. The aim of the researchers is to limit this uncertainty by establishing a budget framework. The central element is the equation for calculating the remaining carbon budget:

Blim = (TlimThistTnonCO2Thist) / TCRE − EEsfb

The budget of the remaining CO2 emissions (Blim) for the specific temperature limit (Tlim) is a function of five terms that represent aspects of the geophysical and human-environment systems: the historical man-made warming (Thist), the non-CO2 contribution to the future temperature increase (TnonCO2), the zero emission commitment (TZEC), the TCRE, and an adaptation for sources from possible unrepresented Earth system feedback (EEsfb).


Term Key choices or uncertainties Type Level of understanding
Temperature limit Tlim Choice of temperature metrics that allow global warming, the choice of pre-industrial reference and consistency with global climate targets Choice Medium to high
Historical man-made warming Thist Incomplete data and methods for estimating the man-made component; see also Tlim Choice and uncertainty Medium to high
Non-CO2 contribution to future global warming TnonCO2 The level of non-CO2 contributions coinciding with global net zero CO2 emissions; depends on policy choices, but also on the uncertainty of their implementation Choice and uncertainty Medium
Non-CO2 contribution to future global warming TnonCO2 Climate reaction to non-CO2 forcers, such as aerosols and methane Uncertainty Low to medium
Zero-emissions commitment TZEC The extent of the decadal zero emission commitment and near-zero annual carbon emissions Uncertainty Low
Transient climate response to cumulative emissions of CO2 TCRE TCRE uncertainty, linearity and cumulative CO2 emissions that affect temperature metrics of the TCRE estimate Uncertainty Low to medium
Transient climate response to cumulative emissions of CO2 TCRE Uncertainty of the TCRE linearity, value and distribution beyond peak heating which is affected by cumulative CO2 emissions reduction
Uncertainty Low
Unrepresented Earth system feedback mechanisms EEsfb Impact of permafrost thawing and duration as well as methane release from wetlands on geomodels and feedback Uncertainty Very low

In the CO2 budget, the unrepresented Earth system feedback (EEsfb) is arguably the greatest uncertainty. These feedback processes are typically associated with the thawing of permafrost and the associated long-term release of CO2 and CH4. However, other sources of feedback have been identified as well. This include, for example, the variations of CO2 uptake by the vegetation and the associated nitrogen availability. Further feedback processes involve changes in surface albedo, cloud cover, or fire conditions.

It remains a challenge to adequately characterize the uncertainties surrounding the estimates of our carbon budget. In some cases, the reason of these uncertainties is inaccurate knowledge of the underlying processes or inaccurate measurements. In other cases the terminology is used inconsistently. For better comparability and flexibility, the researchers propose to routinely measure global surface air temperature values. This method gives robust data for models and model runs over selected time periods. More detailed comparisons between published estimates of the carbon budget are currently difficult because the original data used for publication often are missing. The researchers therefore propose to provide these in the future along with publications.

Breaking down the carbon budget into its individual factors makes it possible to identify a number of promising pathways for future research. One area of ​​research that might advance this field is to look more closely at the TCRE. Future research is expected to narrow down the range of TCRE uncertainties. Another promising area of ​​research is the study of the correlation between individual factors and their associated uncertainties, for example, between uncertainties in Thist and TnonCO2. This could be achieved by developing methods that allow a more reliable estimate of historical human-induced warming. It is also clear that less complex climate models are useful to further reduce the uncertainties of climate models, and hence the carbon budget. Currently, each factor of the framework presented by yhr researchers has its own uncertainties, and there is no method to formally combine them.

At Frontis Energy, too, we think that progress in these areas would improve our understanding of the estimates of our carbon budget. A systematic understanding of the carbon budget and is crucial for effectively addressing global warming challenges.